Class 2: Budget Constraint
Optional textbook reading: Varian, Chapter 2: “Budget Constraint.”
Key Ideas
You walk up to a food truck with $12 in your pocket. Tacos cost $2 and drinks cost $3. What exactly are your options?
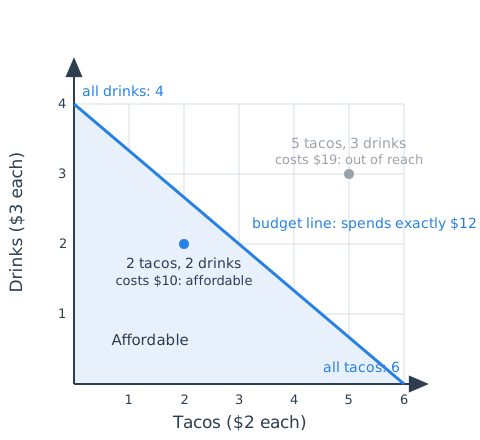
Economists call any shopping list a bundle. “2 tacos and 2 drinks” is a bundle, and so is “6 tacos and no drinks.” Some bundles are within reach and some are not: 2 tacos and 2 drinks costs $4 + $6 = $10, so you can afford it, while 5 tacos and 3 drinks would cost $19, so you cannot. The rule that separates the two is a single inequality called the budget constraint. Measuring everything in dollars,
\[2 \times (\text{tacos}) + 3 \times (\text{drinks}) \leq 12.\]
The bundles that pass this test form your budget set: the complete picture of what the $12 lets you do. To draw it, find the two extreme bundles first: spending everything on tacos buys 6, and spending everything on drinks buys 4. Plot those two points and connect them with a straight line. That line is the budget line, the bundles that use up the $12 exactly. Everything on or below it is affordable; everything above it is out of reach.
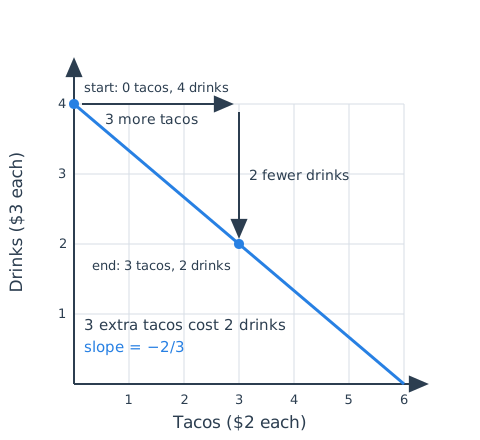
One more idea, the most important of the day. If you are already spending the whole $12 and want more tacos, the money has to come from somewhere: drinks have to go. Three more tacos cost $6, and $6 is exactly two drinks. So the real cost of tacos is not the $2 sticker price; it is the drinks you give up. Economists call this the opportunity cost, and the slope of the budget line measures it: down 2 drinks for every 3 tacos, a slope of \(-2/3\).
Income changes, price changes, taxes, subsidies, and vouchers all work by moving this line: some shift it, some tilt it, and some, as you are about to discover, do less than they appear to. That is what today’s problems are for.
Problems of the Day
Q4: The Three Islands
Kai is choosing which of three islands to live on. Each island has its own currency, and once you settle you earn and spend only there. The only two things anyone buys are fish and coconuts.
On Island A, the weekly wage is 60 shells; fish cost 3 shells each and coconuts cost 6 shells each.
On Island B, the weekly wage is 20 pearls; fish cost 1 pearl each and coconuts cost 2 pearls each.
On Island C, the weekly wage is 120 stones; fish cost 6 stones each and coconuts cost 10 stones each.
Which island offers Kai the best deal? Make your case carefully.
Suppose one year, on whatever island Kai chose, all prices and all wages triple. Islanders protest that “everything costs three times as much.” Should Kai join the protest?
Q5: The Senator and the Economist
A family has $300 a week to spend. To keep things simple, measure “food” and “everything else” in dollars, so one unit of each costs $1. The government wants to help this family eat better, and two proposals are on the table, each costing taxpayers exactly $100 per family per week.
Proposal 1: give the family $100 in cash.
Proposal 2: give the family $100 in food vouchers, which can buy only food and cannot legally be sold.
A senator claims the two proposals are exactly equivalent: “$100 is $100.” An economist claims they are almost equivalent, but not quite.
Map out everything the family could afford under each proposal: every possible combination of food spending and other spending. Where, precisely, do the two proposals differ?
Describe a family whose choices would come out the same under either proposal, and a family whose choices would differ. What does the second family think of the voucher program?
Q6: The Three Dials
You know the food truck: you bring $12, tacos are $2, drinks are $3. Now suppose you control three dials: your budget, the price of tacos, and the price of drinks.
Each challenge below asks whether you can pull it off by turning exactly one dial. If you can, say which dial and which way. If you can’t, convince a skeptic that it’s impossible, no matter which dial or how far you turn it.
Move the drink endpoint of the budget line without moving the taco endpoint.
Make the line steeper without moving the drink endpoint.
Move both endpoints outward without changing the steepness at all.
Move both endpoints and change the steepness.
Answers
Q4: The Three Islands. The wage numbers are a distraction. A wage of 120 stones is not “more” than 60 shells or 20 pearls, because the currencies cannot be compared. What can be compared is what a week’s wage buys. On each island, find the two endpoints of the budget line (all fish, or all coconuts) and the slope, which is the number of fish one coconut costs.
| Island | All fish | All coconuts | Price of a coconut, in fish |
|---|---|---|---|
| A | \(60/3 = 20\) | \(60/6 = 10\) | \(2\) |
| B | \(20/1 = 20\) | \(20/2 = 10\) | \(2\) |
| C | \(120/6 = 20\) | \(120/10 = 12\) | \(5/3\) |
- Islands A and B have the same endpoints and the same slope, so their budget lines coincide: divide every number on Island A by 3 and you get Island B exactly. Kai’s options are identical on the two, whatever the labels on the money.
Island C reaches the same 20 fish but 12 coconuts rather than 10, and its budget line is flatter, because coconuts are relatively cheaper there. Its budget set contains the budget set of A and B. Algebraically, a bundle affordable on A satisfies \(3f + 6c \le 60\), and then \(6f + 10c \le 6f + 12c = 2(3f + 6c) \le 120\), so it is affordable on C too. C also offers bundles the others cannot reach: 12 coconuts and no fish, or 10 fish and 6 coconuts, which costs exactly 120 stones on C but would cost 66 shells on A.
So Island C is the best deal, and the argument does not depend on Kai’s tastes: everything available elsewhere is available on C, plus more. The only exception is a Kai who eats nothing but fish, for whom the three islands tie at 20 fish a week.
- After the tripling, the budget constraint on Island C reads \(18f + 30c \le 360\). Divide through by 3 and it is \(6f + 10c \le 120\) again. The endpoints, the slope, and the set of affordable bundles are all unchanged. Nothing costs three times as much once cost is measured in the units that matter, namely units of the other good: a coconut still costs \(5/3\) of a fish. Kai should not join the protest. (A jar of stones saved from before the change would now buy a third as much, which is a real loss, but a loss on savings rather than on the wage.)
Q5: The Senator and the Economist. Put food spending \(F\) on the horizontal axis and other spending \(O\) on the vertical axis. Before any program the family faces \(F + O \le 300\), a line from \((300, 0)\) to \((0, 300)\).
- Under Proposal 1 the family simply has $400, so \(F + O \le 400\): the line shifts out to run from \((400, 0)\) to \((0, 400)\).
Under Proposal 2 the family still commands $400 of purchasing power, so \(F + O \le 400\), but the extra $100 can only become food. The family’s own $300 is the most it can ever spend on other things, which adds a second constraint, \(O \le 300\). The budget line now has a kink at \((100, 300)\): to the right of the kink it coincides with the cash line, and to the left it runs flat at \(O = 300\) out to \((0, 300)\).
The two proposals differ in exactly one region: the triangle with corners \((0, 300)\), \((0, 400)\), and \((100, 300)\). These are the bundles with less than $100 of food and more than $300 of other spending, which cash allows and vouchers do not. Everywhere else the two budget sets are identical. The economist is right.
- A family that would spend at least $100 on food out of $400 in cash never wants a bundle in the excluded triangle, so it chooses the same bundle under either proposal. A family that already spends $150 of its $300 on groceries is an example. To such a family the voucher is $100 in cash with extra paperwork.
Now picture a family that grows most of its own food and is facing a large rent increase. Given $400 in cash it would choose something like \(F = 40\), \(O = 360\). Vouchers make that bundle unaffordable; the best it can do is the kink, \((100, 300)\): all the vouchers on food, all its own cash on rent. It eats more than it wanted to and spends less on rent than it wanted to. This family is still better off than with no program at all, since \((100, 300)\) beats anything it could afford on $300 alone, but it is worse off than under cash, and it values the voucher at less than $100. It is exactly the family that would sell its vouchers at a discount if the law allowed, and exactly the family whose eating the program changes. The voucher alters food spending only for families that would otherwise spend the least on food, and those are the families that dislike it.
Q6: The Three Dials. Everything about the line comes from three numbers. Writing \(m\) for the budget, \(p_T\) for the taco price, and \(p_D\) for the drink price, the taco endpoint is \(m/p_T = 6\), the drink endpoint is \(m/p_D = 4\), and the slope is \(-p_T/p_D = -2/3\). Each dial appears in exactly two of the three expressions, and that is the whole puzzle.
Turn the drink price dial. It appears in the drink endpoint and in the slope but not in the taco endpoint. Raise drinks to $4 and the drink endpoint falls to 3 while the taco endpoint stays at 6; lower drinks to $2 and it rises to 6. No other dial works: the budget dial moves both endpoints, and the taco price dial moves only the taco endpoint.
Turn the taco price dial, upward. The drink endpoint \(m/p_D\) does not involve \(p_T\), so it stays at 4, while the slope \(-p_T/p_D\) steepens. At $4 per taco the taco endpoint moves in to 3 and the slope becomes \(-4/3\): each taco now costs \(4/3\) of a drink instead of \(2/3\). No other dial works, since the drink price and the budget both move the drink endpoint.
Turn the budget dial, upward. Both endpoints are \(m\) divided by a price, so both move out, and the slope does not involve \(m\) at all, so the steepness is untouched. With $24 the endpoints are 12 tacos and 8 drinks and the slope is still \(-2/3\). A price dial cannot do this, because every price change tilts the line.
Impossible with one dial. For the skeptic: whichever dial you turn, one of the three numbers does not contain it. The budget is absent from the slope, the taco price is absent from the drink endpoint, and the drink price is absent from the taco endpoint. A single dial can therefore move at most two of the three, and the challenge asks for all three. Two dials suffice: a budget of $24 with drinks at $4 gives endpoints of 12 tacos and 6 drinks and a slope of \(-1/2\).